Forecasting Market Direction in the Iranian Stock Exchange: A Quantitative Approach Using Recurring Patterns
Author's Note: This article is an adapted and extended overview of the research paper titled "Detecting the Trend of the Iranian Stock Market with the Matrix Profile Algorithm", co-authored by Siavash Arzhangi and Dr. Abbasali Rezaee. The original study was orally presented at the 1st International Conference on Soft Computing of Engineering Sciences in Industry and Society (ASEIS 2026) and is indexed by the Islamic World Science Citation Center (ISC).
The price behavior of financial assets in capital markets is a complex combination of long-term trends, short-term fluctuations, and recurring cycles. These dynamics are shaped by numerous factors, including macroeconomic variables, news, investor expectations, and the underlying market microstructure. While many traders and analysts practically rely on the concept of "market cycles" to describe recurring periods of price growth and decline, quantitatively and systematically explaining these cycles based on historical data remains an open challenge.
This article explores a fundamental question: Is it possible to identify recurring patterns in price time series based solely on historical price data—without relying on fundamental information, order flows, or news—such that their occurrence leads to future growth or decline cycles with a probability significantly higher than random chance? A positive answer could profoundly improve our understanding of internal price behavior structures and serve as a foundation for designing quantitative stock screening tools.
The Evolution of Time Series Data Mining
In recent years, the introduction of the Matrix Profile data structure by Yeh, Keogh, and colleagues has driven significant progress in discovering recurring patterns (motifs) and anomalies (discords) in time series. The Matrix Profile computes and stores the Euclidean distance of every time series subsequence to its most similar historical counterpart in the form of a numerical profile. This elegant approach makes many classical time series data mining problems—such as motif discovery, similarity search, segmentation, and classification—computationally efficient and scalable without needing to tune a large number of parameters.
Although a substantial portion of Matrix Profile literature has focused on general time series and sensor data, its application in the financial domain has recently gained traction. For instance, researchers like Cartwright have utilized the Matrix Profile to analyze behavioral patterns in financial indices, demonstrating its utility in identifying temporal regions with similar behavior and providing a better visual understanding of market dynamics. Other studies have leveraged recurring patterns extracted from the Matrix Profile as features for machine learning models in time series forecasting and classification tasks.
Despite these advancements, there has been limited research applying Matrix Profile-based recurring patterns to the Iranian stock market, particularly concerning major index constituents and focusing on medium-term cycles. Most existing domestic literature leans heavily on classical technical analysis indicators or standard machine learning models (like neural networks and decision trees), leaving the direct predictive role of recurring structural patterns largely unexplored.
Methodology: A Three-Layered Analytical Framework
To bridge this gap, this research proposes an empirical framework for modeling medium-term cycles of the Tehran Stock Exchange (TSE) using a combination of recurring price patterns and technical indicators. The methodology is structured across three primary layers.
1. Extracting Short-Term Patterns and Defining Medium-Term Returns
The foundation of the model relies on extracting fixed-length subsequences from daily closing prices. A window length of 30 days ($w=30$) is defined as the short-term pattern, capturing enough data to identify trend and momentum status while remaining short relative to the forecasting horizon.
To eliminate the effect of absolute price scales, each 30-day vector is transformed using Z-score normalization (zero mean and unit variance). This ensures that the model focuses purely on the "shape" of the pattern rather than the absolute price level. The corresponding medium-term cycle is then defined as the actual return over a fixed 90-day horizon ($h=90$) following the 30-day window. The sign of this return dictates the overall direction of the medium-term movement, while its absolute value measures the magnitude.
2. Similarity-Based Prediction Model
The core predictive idea is that if a new price pattern is observed in the test data, we can search for similar historical patterns in the training data to estimate future market behavior. This is implemented via a nearest-neighbor model in the feature space.
For every normalized test window, the Euclidean distance to all training windows is calculated, and the $k=20$ nearest neighbors are identified. Two key metrics are derived from these neighbors:
- Expected Return: The average 90-day future return of the 20 closest historical neighbors.
- Neighbor Success Rate (Confidence): The percentage of those neighbors that resulted in a positive return.
The model predicts a "growth" cycle if the expected return is positive and a "decline" cycle if it is negative.
3. Filtering "Strong Signals"
Because a practical trading system does not necessarily need to generate a signal every single day, the third layer introduces a filtering mechanism to extract "strong signals". The logic is that a buy/growth signal is only considered valid if it boasts both a high expected return and a strong consensus among its historical neighbors.
Three distinct filter levels are defined:
- Weak Filter: Expected Return $\ge 5%$ AND Neighbor Success Rate $\ge 60%$.
- Medium Filter: Expected Return $\ge 8%$ AND Neighbor Success Rate $\ge 65%$.
- Strict Filter: Expected Return $\ge 10%$ AND Neighbor Success Rate $\ge 70%$.
Data and Experimental Scope
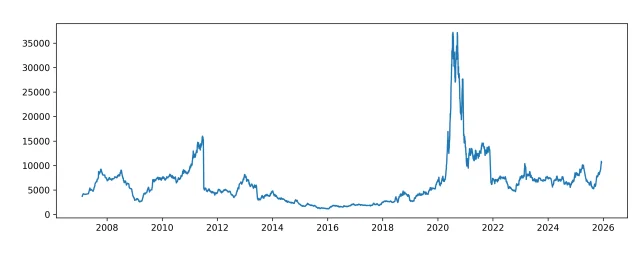
The dataset comprises the daily closing price time series of ten highly influential, index-heavy stocks in the Tehran Stock Exchange: FARS, FOOLAD, FEMELI, KEGOL, TAPICO, SHEPNA, KCHAD, MIDHCO, VAGHADIR, and SHABANDAR. These symbols represent critical industries that heavily impact the overall market index. The data covers the entire available history for each symbol from its initial public offering (IPO) to the present, ensuring the model is exposed to multiple diverse market cycles (both bull and bear markets) rather than a single trending condition.
Key Findings and Results
The evaluation of the proposed framework was conducted in three progressive steps, yielding highly nuanced insights into the predictability of the Iranian market.
Step 1: Baseline Model (Price Patterns Only)
In the first phase, the model relied exclusively on the normalized price patterns without any additional indicators. The results demonstrated that for the vast majority of symbols, the direction prediction success rate hovered between 45% and 49%—essentially slightly below or near random chance (50%). Symbols like SHEPNA, SHABANDAR, KEGOL, KCHAD, and VAGHADIR exhibited near-random behavior, offering no statistically significant edge.
Table 1: Baseline Model Performance (Without Indicators)
| Metric | FARS | FOOLAD | FEMELI | KEGOL | TAPICO | SHEPNA | KCHAD | MIDHCO | SHABANDAR |
|---|---|---|---|---|---|---|---|---|---|
| Test Samples | 828 | 1222 | 1222 | 1292 | 807 | 975 | 1396 | 271 | 779 |
| Success Rate | 48.1% | 46.2% | 50.0% | 49.3% | 53.8% | 45.9% | 44.6% | 70.1% | 46.7% |
| Avg Actual 90-Day Return | 0.9% | -0.5% | 6.9% | -1.9% | 3.4% | -1.6% | 1.8% | -3.2% | 0.8% |
| Return in Correct Predictions | 7.0% | 1.3% | 18.7% | 0.6% | 12.9% | 14.2% | 3.8% | -10.4% | 9.9% |
| Return in Incorrect Predictions | -4.8% | -2.0% | -4.9% | -4.3% | -7.7% | -15.0% | 0.2% | 13.6% | -7.3% |
However, an interesting asymmetry emerged. While the success rate for "FEMELI" was exactly 50%, the average return in correct predictions (18.7%) was substantially larger than the loss in incorrect predictions (-4.9%). Similarly, "TAPICO" showed a slightly higher success rate (53.8%) and positive overall returns.
Step 2: Combining Patterns with Technical Indicators
Based on the baseline results, "FEMELI" and "TAPICO" were selected for deeper analysis. In this phase, classical technical indicators (such as RSI, Moving Averages, and MACD) were appended to the feature vectors. The addition of momentum and trend indicators aimed to resolve the ambiguity of raw price shapes. Two identical price patterns might behave differently depending on whether they occur in an overbought or oversold momentum regime.
The combined model showed immediate improvements across the broader dataset.
Table 2: Combined Model Performance (With Indicators)
| Metric | FEMELI | TAPICO |
|---|---|---|
| Test Samples | 1222 | 807 |
| Success Rate | 53.04% | 52.06% |
| Avg Actual 90-Day Return | 5.98% | 3.17% |
| Return in Correct Predictions | 7.63% | 14.88% |
| Return in Incorrect Predictions | 4.12% | -9.55% |
Step 3: Extracting Strong Signals
The true potential of the framework was unlocked when the "strong signal" filters were applied to the combined model. In the case of "FEMELI", the strict filter dramatically increased the quality of the predictions.
Table 3: Strong Signals Results for "FEMELI"
| Metric | Weak Filter | Medium Filter | Strict Filter |
|---|---|---|---|
| Number of Signals | 301 | 210 | 159 |
| Direction Success Rate | 60.13% | 63.33% | 64.15% |
| Avg Actual Return | 22.97% | 24.64% | 32.13% |
| Return (Correct) | 50.27% | 50.35% | 60.86% |
| Return (Incorrect) | -18.22% | -19.77% | -19.27% |
For "FEMELI", the strict filter narrowed the results down to 159 highly confident signals, which achieved a remarkable 64.15% success rate and an average positive return of 32.13% over a 90-day horizon. When the model correctly predicted growth, the average return exceeded 60%.
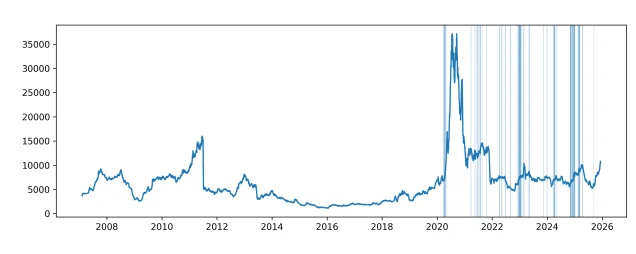
In "TAPICO", applying the filters also improved average returns (reaching over 6%), though the directional success rate remained constrained around 52-53%. This highlights that the synergy between recurring patterns and technical indicators is highly asset-specific.
Conclusion and Practical Implications
This research confirms a fundamental hypothesis aligned with the efficient market theory: relying exclusively on recurring price shapes to predict future movements offers only a weak statistical advantage, often barely outperforming a random guess. The raw shape of a price trend alone is insufficient to build a robust predictive rule.
However, the study reveals that when price patterns are contextualized with technical momentum indicators and subjected to strict confidence thresholds, they can serve as a highly effective quantitative screening tool. For specific stocks, such as "FEMELI", this combination acts synergistically to identify medium-term cycles with a win rate of 64% and an average return of 32%.
It is vital to view these results within the context of the Iranian stock market's structural limitations. Factors such as the absence of robust short-selling mechanisms, daily price fluctuation limits, trading queues, and liquidity constraints mean that identifying a "decline" cycle (as seen heavily in the "MIDHCO" baseline data) is currently more useful for risk management and capital preservation than for direct profit-taking. Furthermore, real-world trading costs and slippage were not factored into these raw returns.
Ultimately, while the Matrix Profile and recurring patterns do not offer a "holy grail" for every stock, they provide a powerful auxiliary layer of intelligence. Future pathways for this framework include integrating supervised machine learning models, incorporating non-price/fundamental data, and stress-testing the methodology across different international markets and time horizons.
How to Cite This Research
If you find this methodology or the findings helpful in your own research or trading systems, please consider citing the original conference paper:
Arzhangi, S., & Rezaee, A. (2026). Detecting the Trend of the Iranian Stock Market with the Matrix Profile Algorithm. Orally presented at the 5th National and 1st International Conference on Soft Computing of Engineering Sciences in Industry and Society (ASEIS), Velayat University, Iranshahr, Iran. (ISC Index Code: 04251-89815).
References
- Yeh, C.-C. M., Zhu, Y., Ulanova, L., Begum, N., Ding, Y., Dau, H. A., Silva, D. F., Mueen, A., and Keogh, E., 2016. “Matrix Profile I: All Pairs Similarity Joins for Time Series”. Proc. IEEE ICDM.
- Zhu, Y., Zimmerman, Z., Senobari, N. S., et al., 2016. “Matrix Profile II”. Proc. IEEE ICDM.
- Yeh, C.-C. M., Van Herle, H., and Keogh, E. J., 2016. “Matrix Profile III”. Proc. IEEE ICDM 2016.
- Yeh, C.-C. M., et al., 2018. “Time Series Joins, Motifs, Discords and Shapelets: A Unifying View”. Data Mining and Knowledge Discovery.
- Zhu, Y., et al., 2017. “Matrix Profile VII: Time Series Chains”. Proc. IEEE ICDM 2017.
- Keogh, E., Dau, H. A., and others, 2023. “Time Series Data Mining: A Unifying View”. Proc. VLDB Endowment.
- Zhu, Y., et al., 2018. “Matrix Profile XI: SCRIMP++”. Proc. IEEE ICDM.
- Cartwright, C., Keogh, E., and others, 2019. “Financial Time Series: Motif Discovery and Analysis Using VALMOD”. Proc. ICCS.
- Dau, H. A., and Keogh, E. J., 2017. “Matrix Profile V”. Proc. ACM SIGKDD 2017.
- Cartwright, C., 2021. “Market Analysis Techniques Based on Matrix Profiles”. Engineering Proceedings.
- Quislant-del-Barrio, R., et al., 2024. “Exploring multiprocessor approaches for scaling the matrix profile”. Journal of Parallel and Distributed Computing.
- Yeh, C.-C. M., et al., 2017. “Matrix Profile IV”. Proceedings of the VLDB Endowment.
- Scott, B., et al., 2024. “Matrix Profile data mining for BGP anomaly detection”. Computer Networks.
- Nikolaou, K., 2024. “CPC-SAX: Data mining of financial chart patterns”. The Journal of Finance and Data Science.
- Fuchs, R., et al., 2024. “Structural Breakpoint Detection in Noisy Time Series”. Proc. IEEE ICDMW.
- Law, S., 2019. “STUMPY: A powerful and scalable Python library for computing the Matrix Profile”. Journal of Open Source Software.
- Guerrini, V., et al., 2025. “Time Series Motif Discovery: A Comprehensive Evaluation”. Proceedings of the VLDB Endowment.
- Silva, D. F., et al., 2025. “Cutting through the noise: Explaining residuals in multivariate time series forecasting”. Pattern Recognition.
- Keogh, E., et al., 2025. “A Unifying View of Time Series Motifs, Shapelets, Chains, and Segments”. Proc. ACM SIGKDD.
- Chinpattanakarn, N., and Amornbunchornvej, C., 2024. “Variable-lag motif following with matrix profile”. arXiv preprint.
- Mälzer, M., and others, 2025. “Application of time series snippets”. Procedia Computer Science.
- Guidotti, R., and D’Onofrio, A., 2021. “Matrix Profile-Based Interpretable Time Series Classifier”. Frontiers in Artificial Intelligence.
- Yeh, C.-C. M., and others, 2024. “Matrix Profile for Anomaly Detection on Multidimensional Time Series”. arXiv preprint.
- Zimmerman, Z., et al., 2019. “Matrix Profile XIV”. Proc. ACM SoCC.
- Cartwright, C., 2024. “Extracting Quantitative Information from Time Series Patterns with the Matrix Profile”. PhD Thesis, Dublin City University.